


The Wi-Fi Monitor is available starting from CTC-App version 4.15. It displays the Wi-Fi signal reception strength of a locomotive as a graph over time.
You can open the Wi-Fi Monitor via the “Wi-Fi Monitor” button in the locomotive configuration of the respective locomotive.
The example shows the Wi-Fi signal progression during one lap on our garden railway test layout (see article Automation in the Garden):
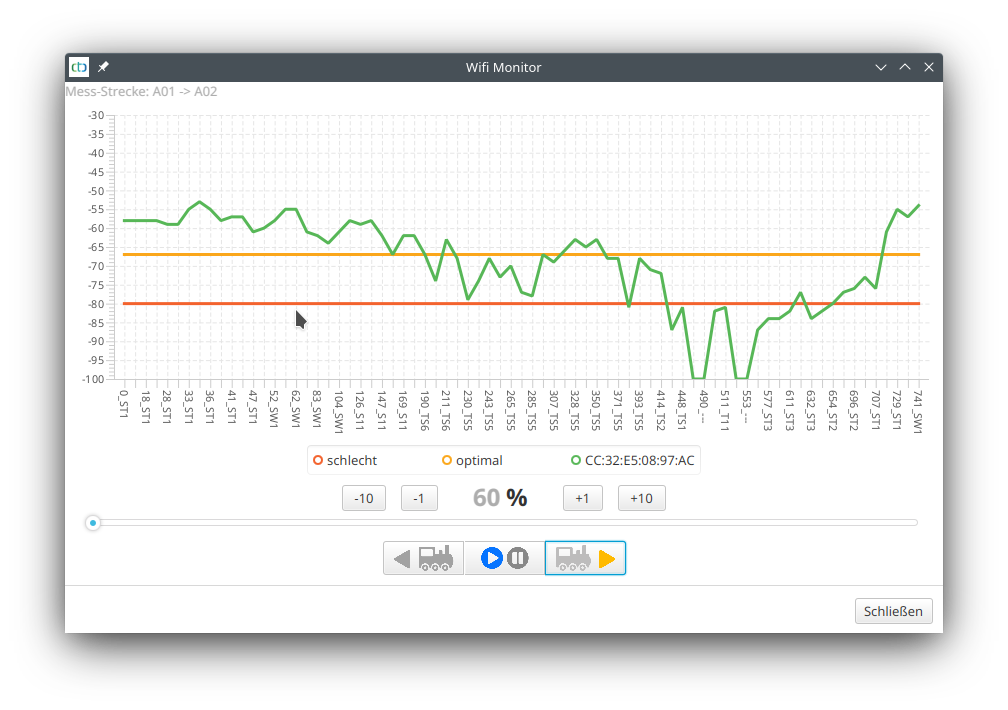
The vertical scale shows the signal strength in dB, while the horizontal scale shows time. The time axis is labeled in tenths of a second (x 0.1 s), followed by the last passed balise. In the example, the locomotive’s reception signal strength was -79 dB after 23.0 seconds (and after balise TS5). Between 44.8 seconds and 55.3 seconds, between balises TS1 and ST3, there were two brief dropouts (-100 dB).
Starting from CTC-App version 4.38, the red line indicates the locomotive’s “Signal min. db” value, i.e., the point at which the locomotive actively begins searching for a better Wi-Fi connection.
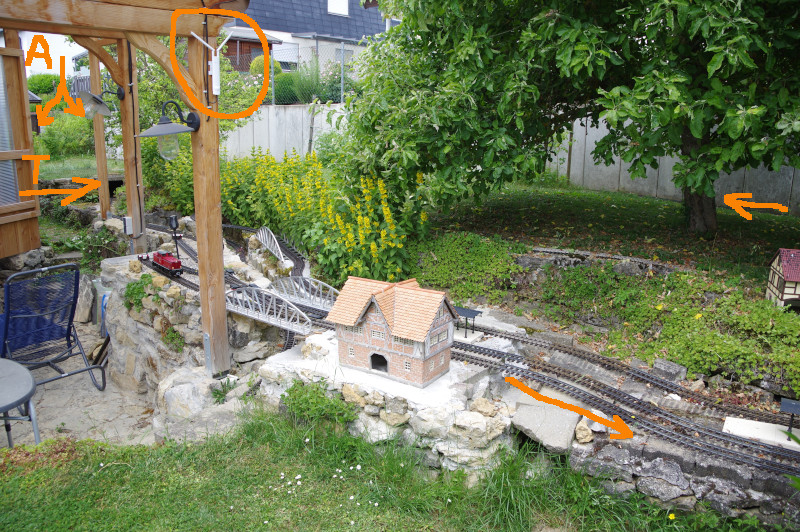
The following image shows the layout where the measurements were taken:
- In the front, the outdoor access point (TP-Link AC1200), to which the locomotive was connected the entire time, is circled.
- In the back, marked with “A,” are the two spots where the Wi-Fi briefly drops out: a slight depression and, before that, currant bushes.
- The arrow labeled “T” points to a tunnel approximately 2 meters long, which obviously does not pose a problem. However, it is only covered with concrete slabs (no soil above) and is open toward the access point.
- The two unlabeled horizontal arrows mark the track layout. The track circles the apple tree, then runs along the concrete wall to the end of the garden, about 15 meters from the access point, and finally returns through the tunnel.
- The test run was conducted with the red BR 251 locomotive visible in the center-left of the image.
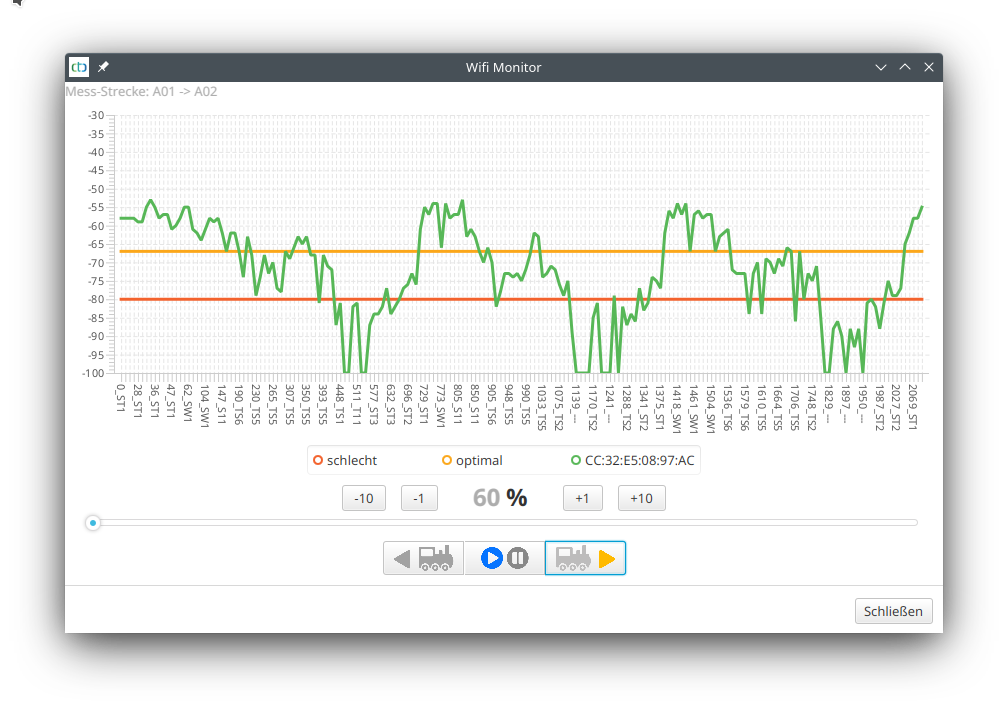
After three laps, the graph looks like this. The three repetitions are also clearly visible in the graph:
Notes:
- For those who want precise details, the data transmitted during the measurement can be found as “Wifi-XXX.csv” in the data folder of the CTC-App (XXX is the name of the locomotive). This file can be opened, for example, with LibreOffice Calc (Excel may work but is not guaranteed) and can be analyzed in detail there.
Mesh Operation
In mesh operation (multiple access points with the same SSID), a separate line is displayed for each access point (here green and blue), making it easy to see when the locomotive has switched access points. The legend shows the MAC addresses of the access points.
Our garden railway test layout has since been expanded, and the access point marked in the photo has been moved four meters to the left to the other support of the terrace roof. This results in larger areas of the layout that are no longer covered by this single access point. The second access point is mounted at the rear corner of the house near the two locations marked with “A” in the photo.
The red line now shows the minDb value of the BR251 locomotive, which was also used here. Three laps were driven on the same track as in the previous example:
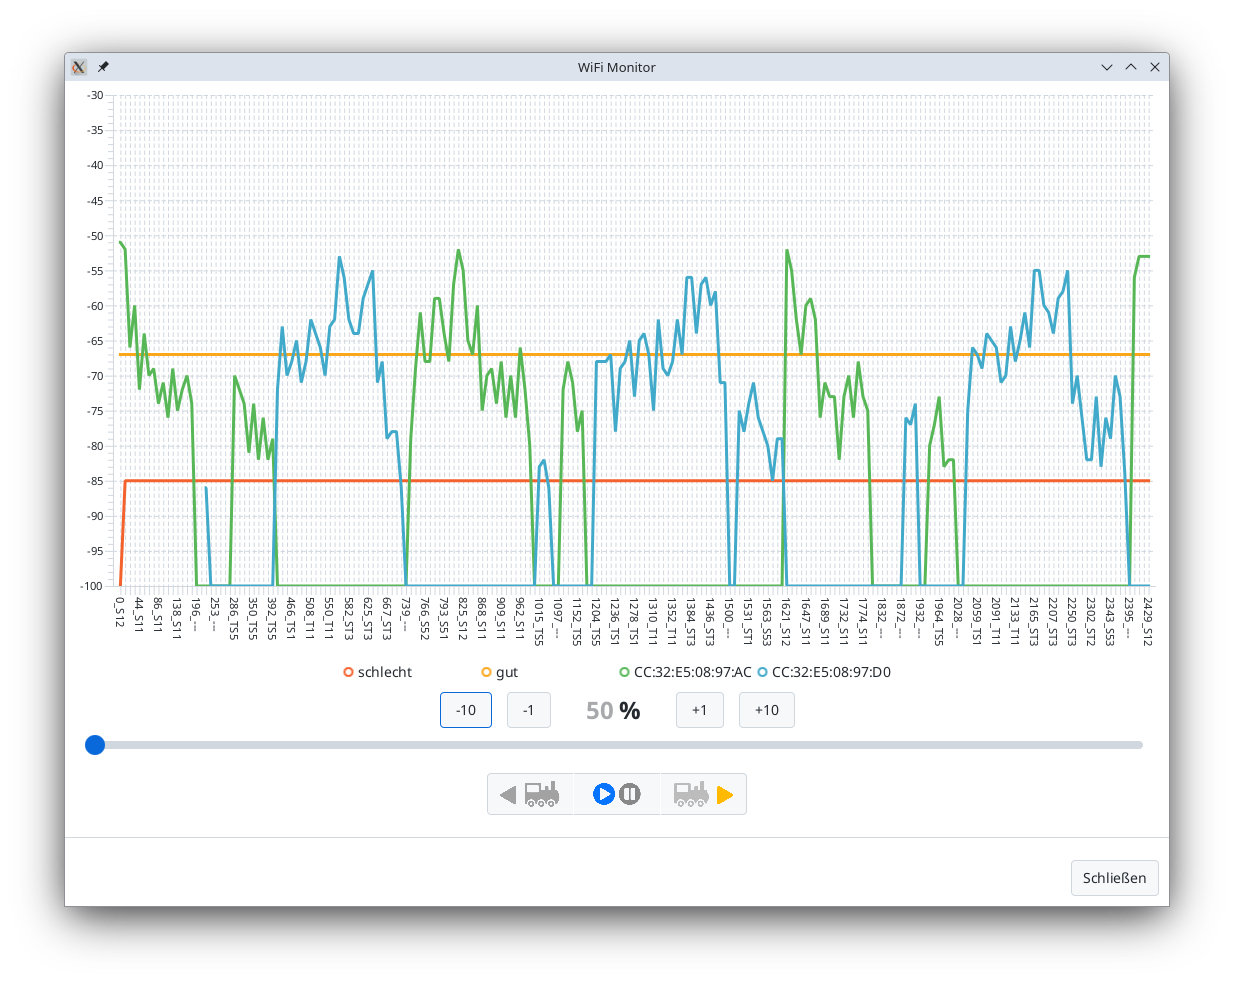
The dropouts detected in the first example behind the berry bushes are now optimally covered by the blue access point. However, there is now a critical point between the raspberries (center of the image at the concrete wall, obscured by the apple tree). There, the signal from the blue access point is shielded by the pear tree (behind the lamp in the image), and the signal from the green access point is blocked by the apple tree.
Note:
- For mesh operation, the locomotive should have at least firmware version 20250627 (CTC-App 4.40). In earlier versions, mesh operation was partially available but not yet reliable.